
Documentation Technique
1.1 - INTRODUCTION: WHAT IS OOC DEBUG NOTIFIER?
1.2 - PHILOSOPHY: THE 5 PILLARS
1.3 - PERFORMANCE & ARCHITECTURE
2.1 - INSTALLATION PROCEDURE
2.2 - SYSTEM CONFIGURATION
2.3 - ENGINE INITIALIZATION
2.4 - CREATING CLIENT ASSETS
3.1 - THE BRAIN: AC_DEBUGNOTIFIER
3.2 - THE "PRODUCTION SAFE" MODEL
3.3 - OBJECT MANAGEMENT
3.4 - RUNTIME OPTIMIZATION
4 - CONFIGURATION & CATEGORIES
4.1 - THE CATEGORY CONCEPT
4.2 - STARTUP BEHAVIOR
4.3 - INPUT MANAGEMENT
4.4 - [EXTRA] ADVANCED GAMEPLAY TAG CREATION
5 - NOTIFICATION SYSTEM (EVENTS)
5.1 - ANATOMY OF A NOTIFICATION
5.2 - SEVERITY LEVELS & DISPLAY RULES
5.3 - DYNAMIC LINKS
5.4 - WORKFLOW: CREATING AND CALLING A NOTIFICATION
6 - DYNAMIC MONITORING (LIVE DATA)
6.1 - DATA TYPES
6.2 - SMART THRESHOLDS & COLORS
6.3 - EXPANDED VS. COMPACT VIEW
6.4 - WORKFLOW: CREATING AND UPDATING A VALUE
7 - INTERFACE & UX (DEBUG PANEL)
7.1 - PANEL STRUCTURE
7.2 - STATUS INDICATORS
7.3 - CONTROLS & NAVIGATION
7.4 - EXTENDED INFOS
7.5 - VISUAL CUSTOMIZATION (DATA ASSET UI)
8.1 - FAQ & TROUBLESHOOTING
1. OVERVIEW
1.1 - Introduction: What is OOC Debug Notifier
OOC Debug Notifier is an advanced runtime monitoring system designed for Unreal Engine developers who demand total visibility into their game's behavior.
Where traditional Print Strings prove to be limited, volatile, and often clutter the logs, this plugin offers a structured, persistent, and Data-Driven interface. It allows you to track the internal state of the project (variables, AI states, complex systems) and report specific events without ever interfering with the game logic.
It acts as a non-intrusive observation layer that transforms "disposable" debug messages into a genuine knowledge base for the development team.
1.2 - Philosophy: The 5 Pillars
The plugin is built upon five fundamental principles that guide its operation and daily utility:
1. Live Monitoring (Visualize the State):
Track the evolution of your variables (Bool, Float, Text, etc.) in real-time. The system allows you to see the health of a system without having to dig through logs or set breakpoints that break the game's flow..
2. Event Management (Visualize the Flux):
Unlike log messages that scroll by and disappear, OOC notifications are stored in a persistent history throughout the session. You can know exactly when and why an event occurred, even 10 minutes after the fact.
3. Project Memory (Context & Documentation):
The system integrates "Descriptions", "Causes",and "Solutions" fields. This is embedded documentation: when an error occurs, the developer (or atester) immediately sees the intent behind the code and the procedure to fix the problem..
4. Production-Safe (Trustworthy Architecture):
The tool is designed to remain in the code. You do not need to "clean up" your Blueprints before compiling your final build (Shipping). A simple option allows you to make the plugin completely inactive, guaranteeing zero performance cost.
5. Mental Clarity (Reducing Cognitive Load):
By separating continuous data (Dynamics) from one-off events (Notifications) and allowing for category-based sorting, the plugin helps the brain focus on the essentials without being overwhelmed by debug "noise".
1.3 - Performance & Architecture
The technical architecture of OOC Debug Notifier has been optimized to be as lightweight as possible:
Interception Model:
All debug functions pass through a "security gate". If the system is disabled (IsActive = False), execution stops immediately at the start of the function. No calculations are performed, no text is formatted, and no UI is updated.
Delta-Update Logic:
For variable monitoring, the plugin does not send a refresh command to the interface on every Tick. It compares the new value to the previous value in memory and only updates the Widget if a change is detected.
Data-Driven Approach:
By offloading message logic into Data Tables and presentation into Data Assets, the plugin avoids overloading execution Blueprints with heavy character strings and complex styling parameters.
2. INSATALLATION & SETUP
The plugin installation follows a 6-step "critical path". This flow must be followed in order to ensure that system dependencies (Tags and Assets) are correctly initialized.
1 - Activation : Activate the plugin and restart the Editor.
2 - Tags Configuration: Add the system tag table in the Project Settings.
3 - Setup Controller : Add the component to the Player Controller.
4 - PIE Stabilization: Start/Stop the game once (Safety step).
5 - Assets Duplication: Create your own versions of the templates.
6 - Assignment: Link your assets to the component.
2.2 - System Configuration
SYSTEM GAMEPLAY TAGS
Once the plugin is activated, you must register the tags required for its internal operation:
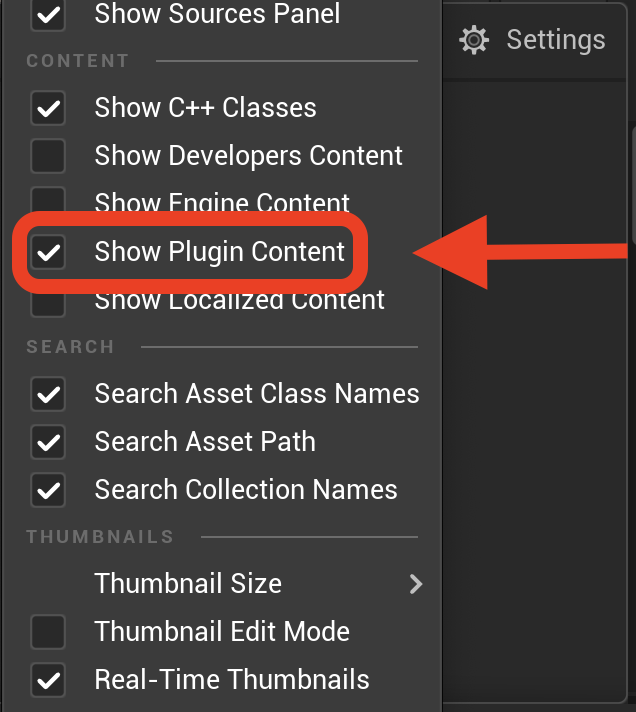
1 - In the Content Browser, ensure that "Show Plugin Content" is enabled (View Options).
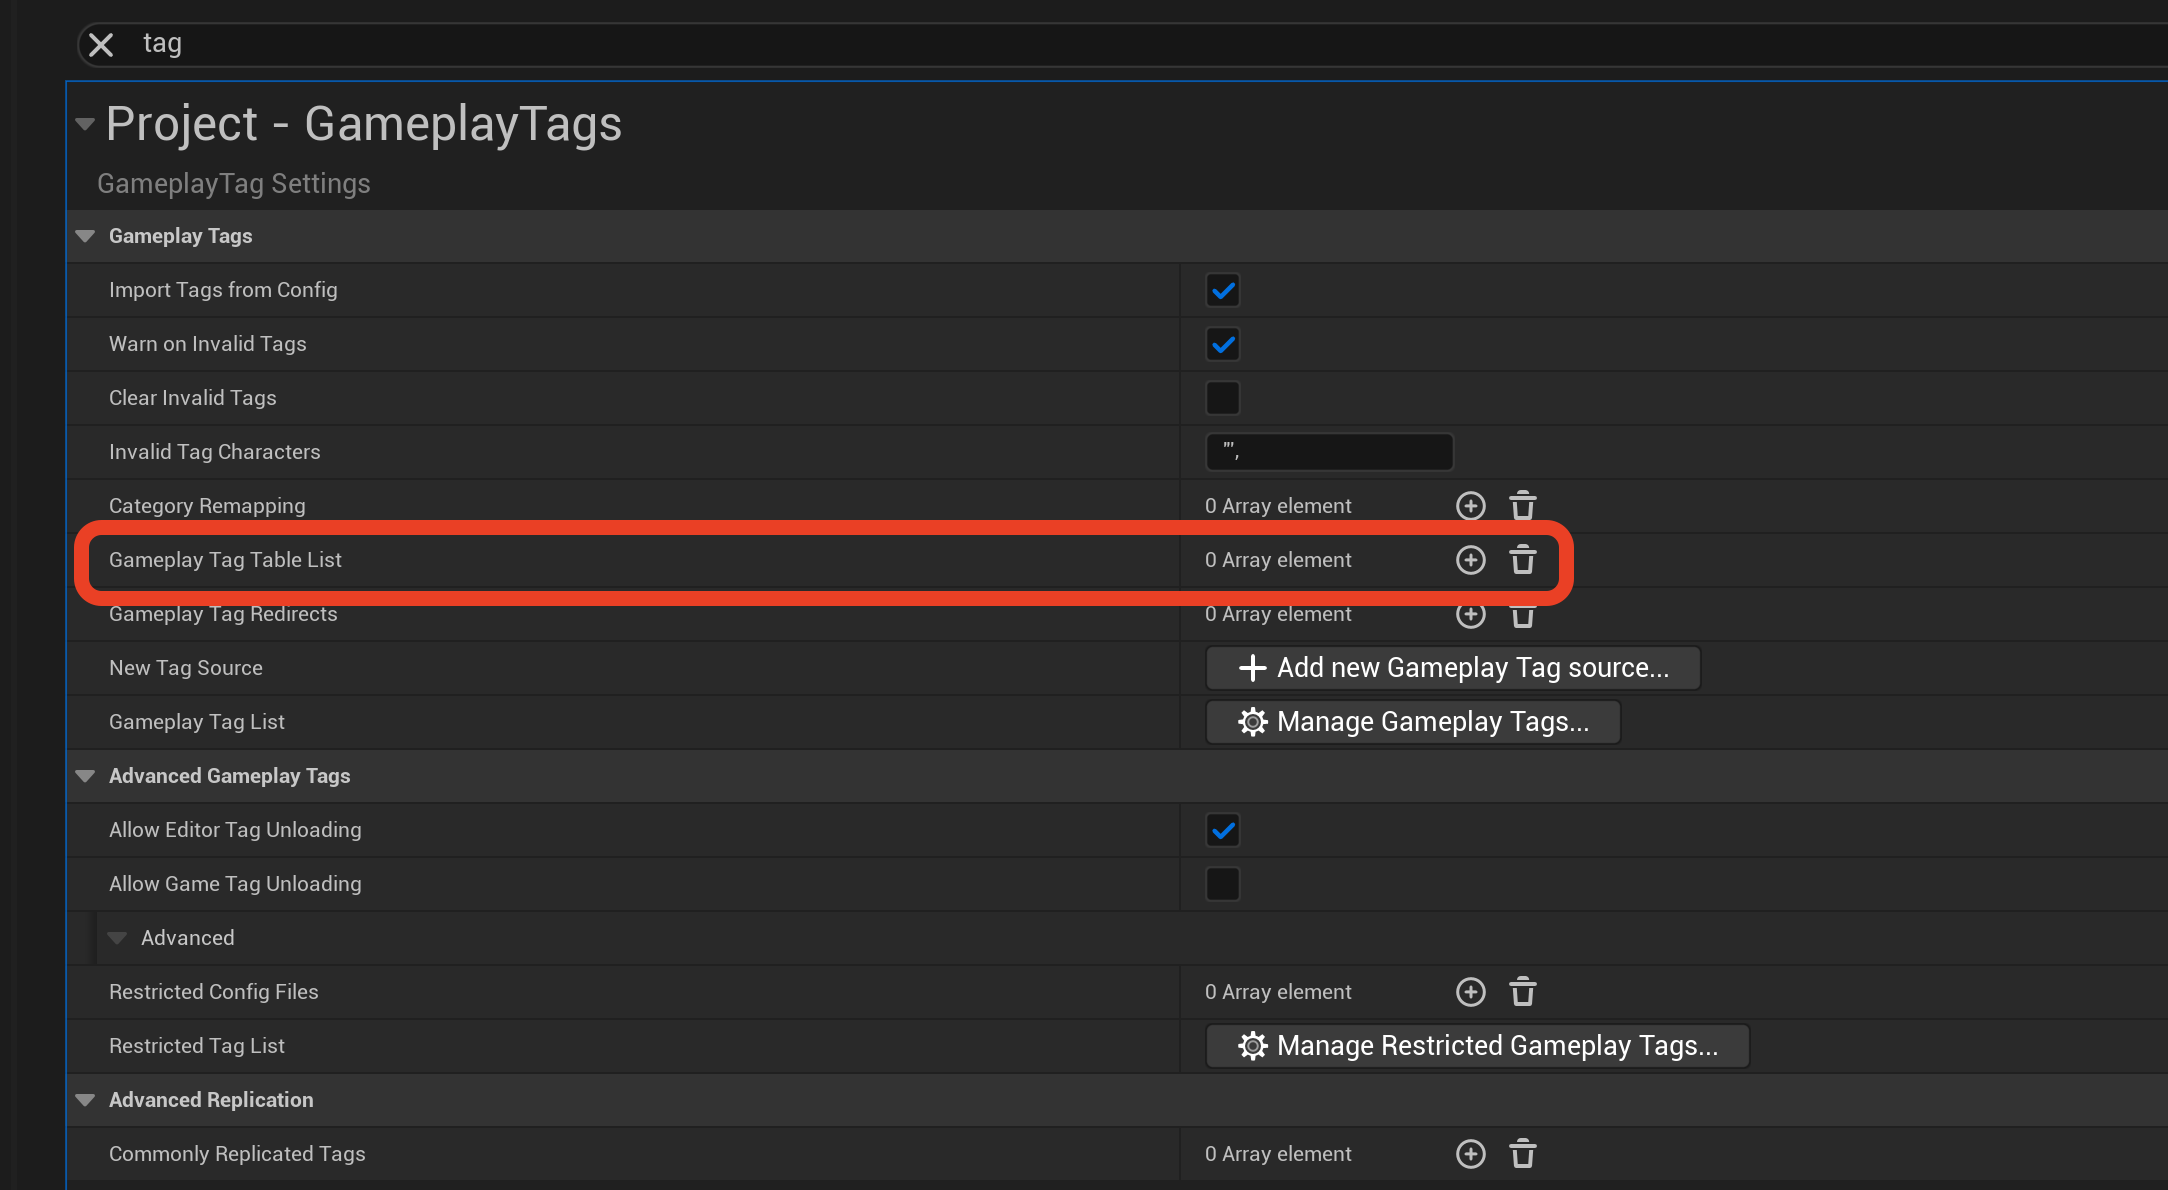
2 - Go to Edit > Project Settings > Gameplay Tags.
3 - In the Gameplay Tag Table List section, add a row and select:
4 - DT_GTT_OOC_DebugSystem.
⚠ WARNING: Never modify this table and never use tags located in the OOC namespace. They are reserved for the plugin's internal logic.
PLAYER CONTROLLER
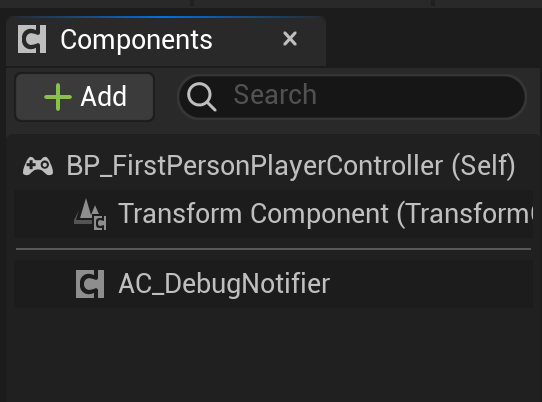
The system resides on the client. You must add the "brain" component to your Player Controller class:
1 - Open your Player Controller.
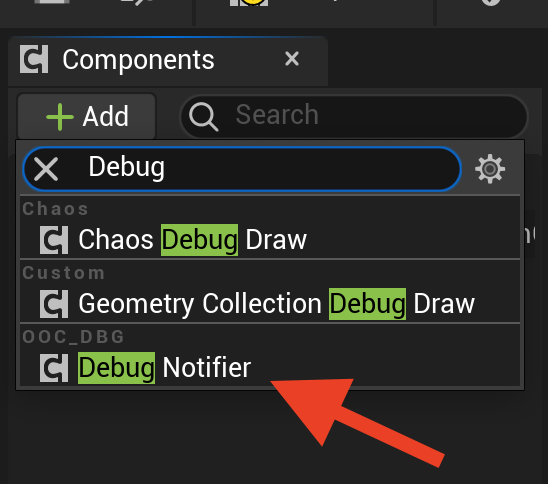
2 - Add the AC_DebugNotifier component.
3 - Compile and save your Blueprint
2.3 - Engine Initialization
This is the most critical setup step. At this stage, the system is wired but the Gameplay Tags have not yet been "stabilized" by the engine within the editor's context.
Attempting to open or modify a plugin Data Asset without performing this step may cause the engine to crash immediately.
• The Procedure: Press the Play button (PIE) to launch the game, wait for one second, then press Stop.
This action forces Unreal Engine to register tag definitions in RAM. Once performed, you can safely manipulate files.
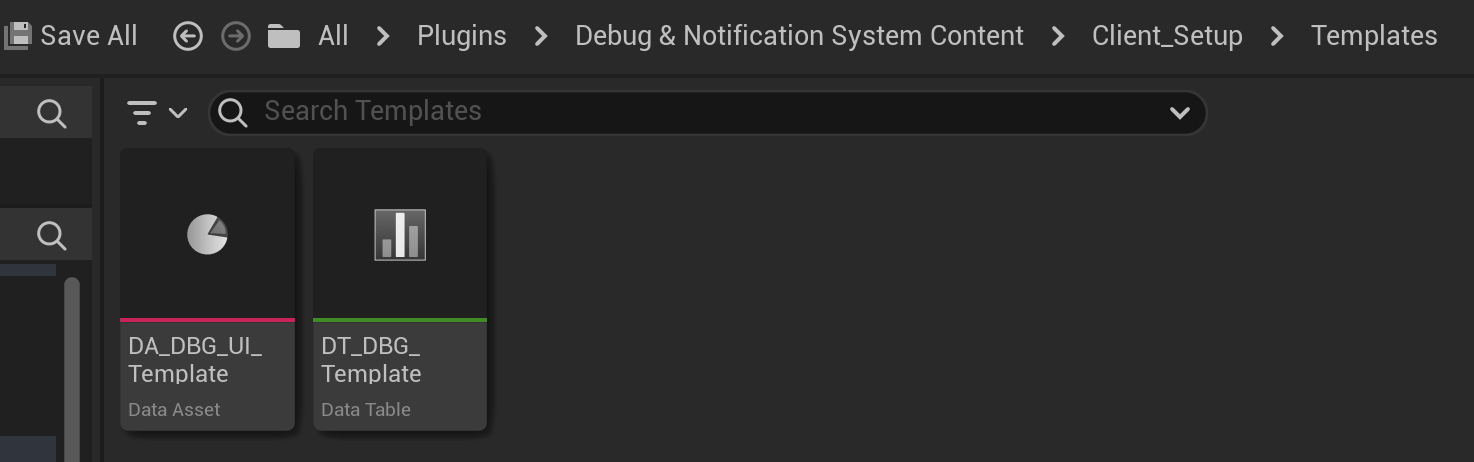
2.4 - Creating Client Assets
The plugin provides templates that you must duplicate for your own project. Never work directly in the files located within the plugin folder.
1 - Navigate to: Plugins/DebugNotifierContent/ClientSetup/Templates..
2 - Select: DT_DBG_Template (Content) and DA_DBG_UI_Template (Style/UX).
3 - Duplicate them (Ctrl+D) and move your copies into your game folders (e.g., /Game/Main/Debug/).
4 - Rename them as needed (e.g., DT_MyProject_Debug)
5 - Cleanup: You can now disable "Show Plugin Content" to keep your Content Browser tidy.
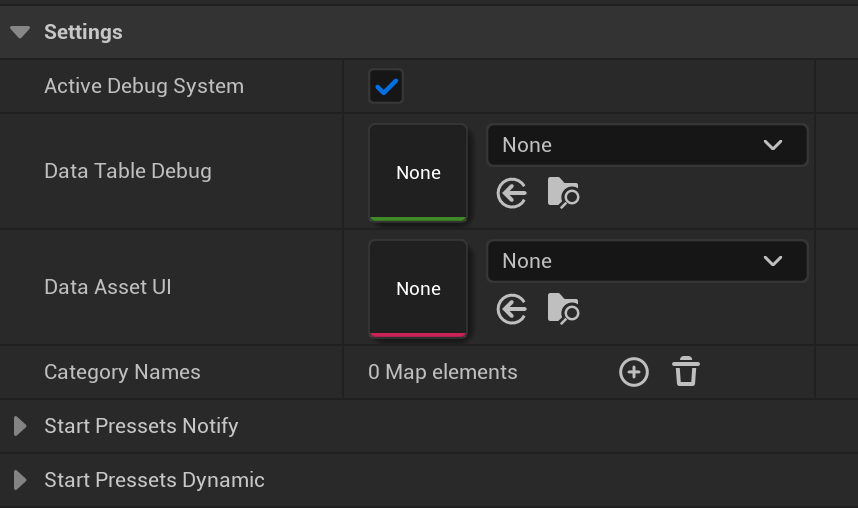
6 - Final Assignment: Return to your Player Controller, select the AC_DebugNotifier component and, in the settings, drag and drop your two freshly created copies into the respective fields.
3. TECHNICAL ARCHITECTURE
This section details the internal functioning of the plugin and how it interacts with your project without degrading performance.
3.1 - The Brain: AC_DebugNotifier
The AC_DebugNotifier component is the nerve center of the system. Placed on the Player Controller, it centralizes several critical responsibilities:
• Runtime Memory: It keeps the history of all notifications received during the session.
• Data Cache: It stores the current state of each "Dynamic" value to allow data comparison and update the UI only when necessary.
• UI Manager: It drives the creation and update of the debug Widget.
• Sorting System: It manages Gameplay Tag containers to filter the display in real-time according to the categories selected by the user.
3.2 - The "Production Safe" Model
One of the plugin's greatest strengths is its ability to coexist with your final code. The system uses a Gatekeeper architecture:
• The Is Active Boolean: Located on the component, this parameter acts as a general master switch.
• Source Filtering: Every function in the Function Library (e.g., DBG Call Notify) first checks if the component exists and if it is active. If not, the code performs an immediate Return.
• Zero Impact in Shipping: This means that even if you leave thousands of debug calls in your Blueprints, they will not consume any significant CPU cycles in the final game.
The engine will not even load the plugin's graphical interface, and it will not cause any errors in your project.
3.3 - Object Management
To monitor an object, the system must first register it in its database. It uses two complementary approaches:
AUTOMATIC REGISTRATION
At initialization (Controller's BeginPlay), the system performs a global scan. All Actors present in the level that implement the BPI_DBG_Dynamic interface are automatically detected and added to the monitoring list.
MANUAL REGISTRATION (ADDOBJECT)
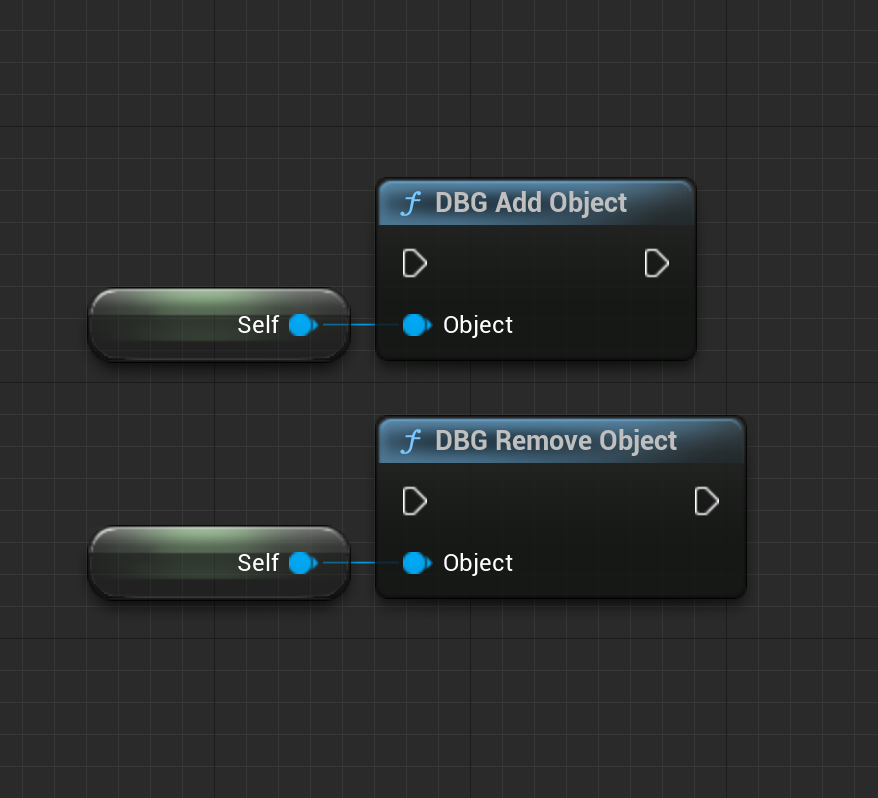
However, many objects cannot be detected by an initial scan (objects spawned later, Actor Components, Animation Blueprints). For these cases, you must use the following function:
DBG Add Object: To be called in the BeginPlay of the object or component you wish to monitor. The system intelligently handles duplicates and automatically cleans up references if the object becomes invalid (destruction).
UNREGISTRATION & AUTOMATIC CLEANUP (REMOVEOBJECT)
DBG Remove Object function. While accessible to the user to manually stop monitoring an object at a specific time, its daily use remains optional.
The system integrates a proactive memory management mechanism: as soon as an object becomes invalid (destruction or unloading), the plugin immediately removes it from its database along with all its internal references. This automatic procedure prevents memory leaks and ensures that the system keeps no trace of stale objects.
PARENT/CHILD MONITORING (TIME-SAVING BEST PRACTICE)
It is not necessary to manually register and set all child components individually. While you can certainly use DBG Add Object on specific children if you require highly granular monitoring for each of them, the most efficient method is to simply monitor the parent Actor.
The system is designed to automatically stay updated with each child. This hierarchical approach was specifically built to save significant development time, keeping your event graphs clean and preventing the need to create massive amounts of nodes for every single child element.
3.4 - Runtime Optimization
Displaying dozens of values changing every second on an interface can be expensive for the GPU/UI. OOC Debug Notifier uses a Delta-Update logic:
1 - When a dynamic value is sent to the system, it is compared to the value stored in the AC_DebugNotifier cache.
2 - If the value is identical to the previous one, the system discards the call and does not communicate with the UI Widget.
3 - The UI is only refreshed when an actual change is detected.
This optimization allows for the monitoring of complex systems on objects running on Tick without suffering the usual slowdowns associated with dynamic text display.
4. CONFIGURATION & CATEGORIES
This section covers the logical organization of your debug data and the customization of the system's initial behavior.
4.1 - The Category Concept
The system does not impose any predefined categories because every project has a unique architecture. Flexibility is therefore total:
Organization Freedom: Users are encouraged to create their own hierarchy. An effective strategy is to sort by Source(e.g., BP_Hero, ABP_Hero) and by Family (e.g., Character).
Exemple : An element can be tagged BP_Hero for precise monitoring and also belong to the Character category. This allows you to filter either the specific object or the entire "Character" family transversally.
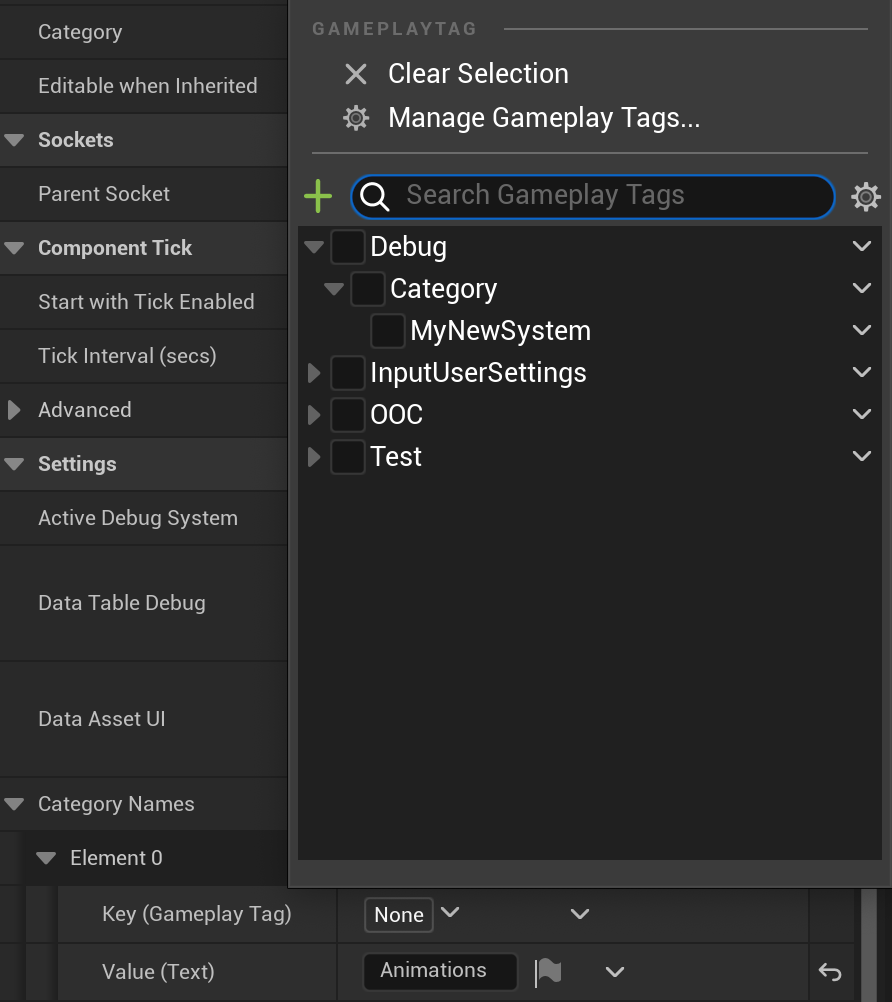
Category Map (AC_DebugNotifier): By default, this Map is empty. This is where you register your created Gameplay Tags and associate them with a Display Name. This name will appear on the Debug Panel buttons at runtime.
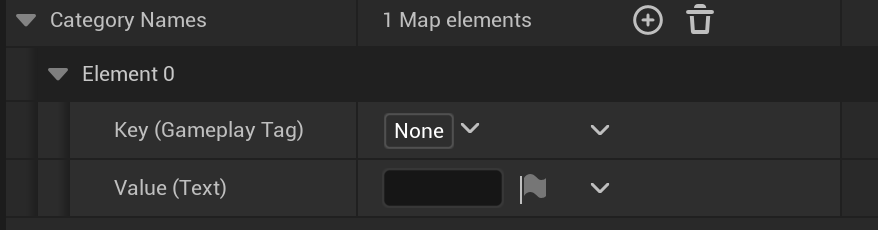
Category management is one of the pillars of the system. It relies entirely on Gameplay Tags to offer total sorting flexibility:
Transversal Filtering: Categories act as filters for the entire plugin. If you select the "Character" category, the system will display both Notifications and Dynamic Values associated with this tag, regardless of the object emitting them (BP_Hero, AnimBP, etc.).
Total Independence: The system has its own internal tag containers. It does not interfere with your project's tags. You can use your own tags as category references without fear of disrupting your existing gameplay logic. The system uses its own structures to isolate its data from yours.
Special Modes:
ALL: Displays all recorded data, bypassing filters.
DISABLED: Hides the display without resetting your category selections. Useful for temporarily "cleaning" the screen.
4.2 - Startup Behavior
The AC_DebugNotifier component allows you to define the system's state upon game launch via several configurable parameters in the component instance details:
Start With All Categories: If enabled, the system automatically selects the "ALL" filter at startup. Ideal for having an immediate overview without manual manipulation during each test session.
Start Disabled: Allows starting in "Silent" mode. Default categories are correctly loaded, but the display is hidden. This is the recommended setting to have debug ready in the background but invisible until a manual trigger.
Default Categories: A list (Container) where you can specify the category tags you want enabled by default at launch (e.g., Debug.Category.Player).
Note : If "Start With All" is checked, this list is ignored as the system will force the display of all content.
⚠ RUNTIME FLEXIBILITY: It is important to note that these starting conditions are not final. At any time during the game (Runtime), the user can modify these parameters, change categories, or enable/disable the HUD via the Debug Panel.
4.3 - Input Management
Interface control (opening the panel, hiding the HUD) is managed by a file located in the plugin folder: IMC_DebugSystem (Input Mapping Context).
Authorized Customization: You are free to change the keys assigned to actions (e.g., from TAB to F1) to suit your workflow.
⚠ RESTRICTIONS AND SECURITY: This is the only element linked to the internal system that is exposed and allowed to be adjusted, but it imposes strict rules:
Never move, duplicate, or delete this file.
Never add or remove "Actions" inside. The plugin expects specific action identifiers.
Any structural modification (other than a simple key change) will break the communication between your keyboard inputs and the plugin's brain.
4.4 - [EXTRA] Advanced Gameplay Tag Creation
While it is entirely possible to manage your tags directly via .ini files or the classic Unreal tool, using a Gameplay Tag Table is a very simple and accessible alternative that we recommend for organizing your debug categories.
1 - Table Creation: Create a Data Table of the type GameplayTagTableRow..
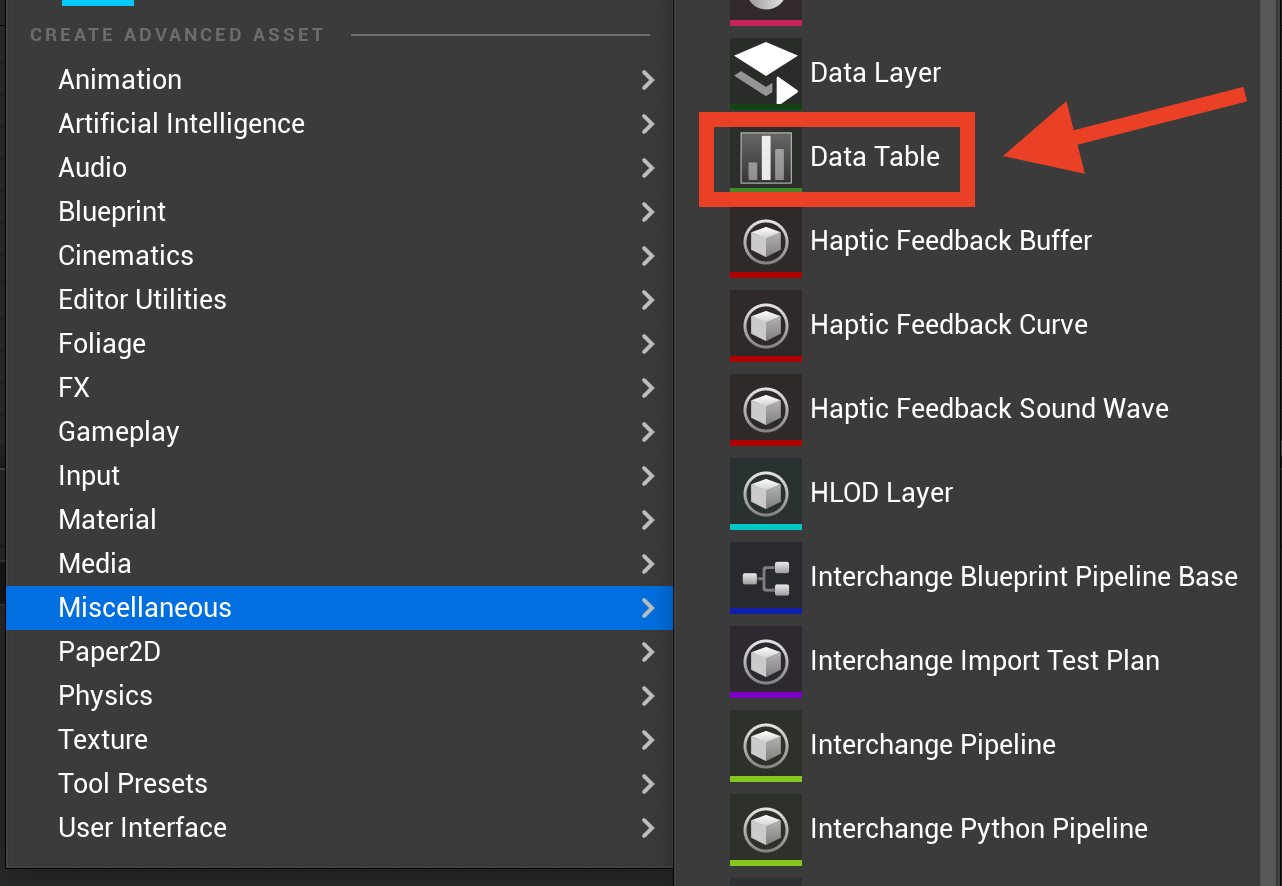
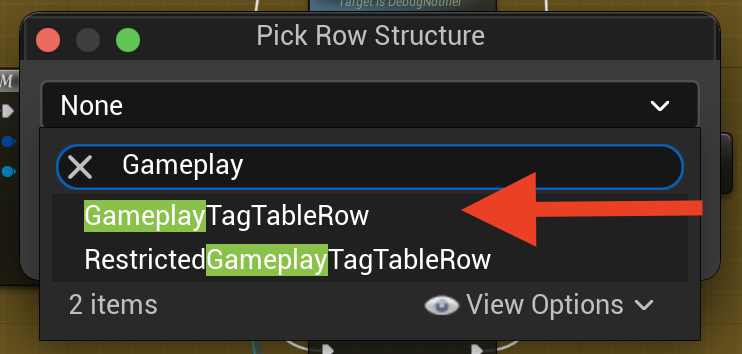
2 - Adding Tags: Add your rows to this table. Each row represents a new tag (e.g., Debug.Category.MyNewSystem).

3 - Project Registration: Go to Project Settings > Gameplay Tags and add this new table to the Gameplay Tag Table List.

4 - Usage : Your tags are now available throughout the project and can be selected in the AC_DebugNotifier component Map or in your debug Data Tables.
5. NOTIFICATION SYSTEM
EVENTS
Notifications are one-off messages triggered by specific events in your game. Unlike dynamic monitoring, they serve to signal a precise state change or an error, while maintaining a searchable history.
5.1 - Anatomy of a Notification
Each notification is defined in your debug Data Table. It is not limited to a simple text message; it serves as "Project Memory":
Display Name (Title) : The short name that appears immediately on screen.
Description : A quick summary of the event.
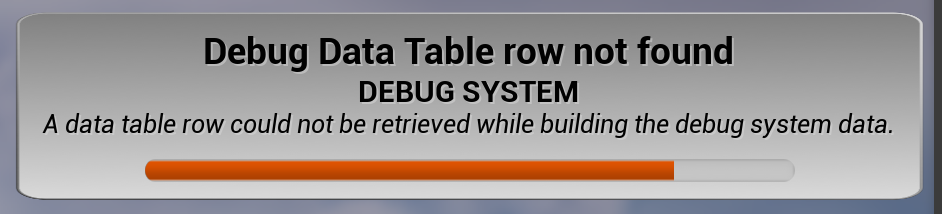
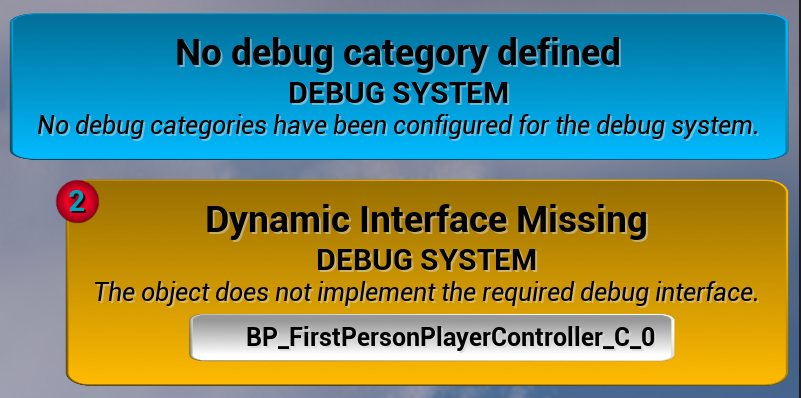
Occurrence Counter (Badge): To avoid cluttering the interface, the system does not duplicate identical notifications. If a notification is called multiple times, a numerical badge is displayed on it to indicate the number of repetitions.
5.2 - Severity Levels & Display Rules
The system uses four severity levels, each with its own visual and logical behavior:
Low (Info/Trace) : Displayed briefly and auto-acquits (dismisses itself). Ideal for confirming the success of a minor action.
Medium (Warning) : Remains displayed on screen until manual acquittal or the end of the session.
High (Error) : Same as Medium level, but with a more aggressive color code (Orange/Red) to attract attention.
Critical (Fatal/Alert) : This is the highest level. A critical notification ignores all category filters. It will always appear, even if you have hidden all categories, as it signals a major issue requiring immediate action.
5.3 - Dynamic Links (DynLinks)
Dynamic Links (DynLinks) allow you to merge the static nature of a notification with the variability of monitoring. They allow you to insert the current value of a "Dynamic" debug entry directly into a notification's text.
Syntax: In your notification description (Data Table), use curly braces with the dynamic value tag: The player lost {Debug.Dynamic.Player.Health} HP.
Memory Order: For this to work, the system must have the value in memory. It is therefore imperative to send the dynamic value update just before calling the notification.
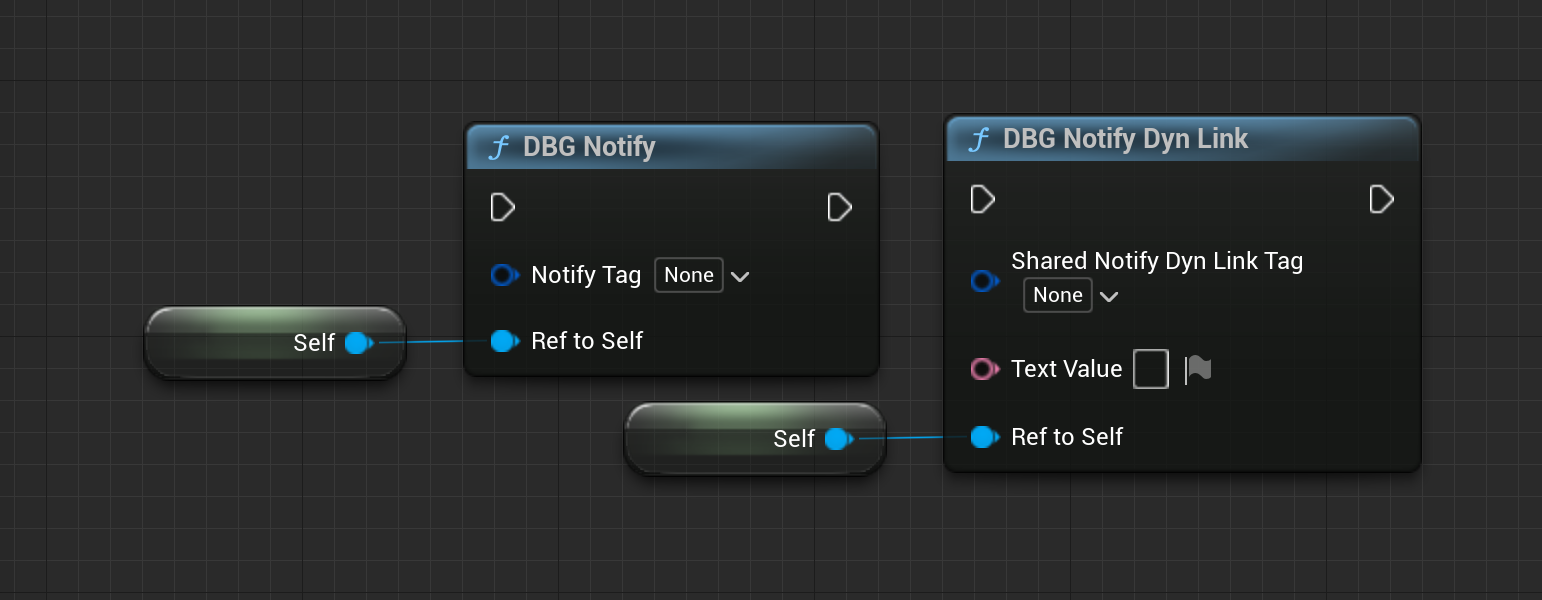
DBG Notify DynLink Node: This special function simplifies the process. It allows you to pass a value and a tag, and the system takes care of updating the dynamic value AND triggering the associated notification in a single step.

5.4 - Workflow: Creating and Calling a Notification
The process is standardized to ensure the cleanliness of your project:
1. Tag : Create a unique Gameplay Tag (e.g., Debug.Notify.Quest.Failed).
2. Data Table: Add a row in your debug table corresponding to the object where this notify is implemented, assign the tag, and fill in the documentary fields (Name, Description, Causes, Solutions, etc.).
3. Call: In your game logic, use the DBG Call Notify node.
Note : If you are using DynLinks, prioritize the DBG Notify DynLink node for calling a single DynLink sharing the same tag as the notify. If you want several DynLinks, call the DBG_Dynamic_(float, bool, text) functions once before the Notify.
4. Anti-Spam : The system automatically detects if a notification is called more than 99 times (e.g., placed in a Tick by mistake). In this case, it blocks the tag and sends a system alert to protect performance and readability.
6. DYNAMIC MONITORING LIVE DATA
Dynamic monitoring is designed to observe the continuous state of your systems. Unlike notifications which are one-off events, "Dynamics" are persistent data streams that allow you to see, at a glance, if a variable is behaving as expected.
6.1 - Data Types
The system supports three fundamental data types, covering the majority of debug needs:
• Boolean : Ideal for monitoring activation states (e.g.: IsGrounded, IsAttacking).
• Float : For all numerical values (e.g.: Health, Speed, Stamina).
• Text : For monitoring complex character strings and any other variable types. (e.g.: CurrentStateName, TargetActorName ou Vector, Rotator, etc…, ).
6.2 - Smart Thresholds & Colors
One of the most powerful features of dynamic monitoring is the system's ability to automatically change the display color based on the received value.
• BOOLEAN LOGIC:
◦ Color 1 : Applied if the value is True.
◦ Color 2 : Appliquée si la valeur est False.
• TEXT LOGIC:
◦ Color 1 : Applied if the text is empty or equal to "None".
◦ Color 2 : Applied for any valid, non-empty text.
• ADVANCED FLOAT LOGIC (THRESHOLDS):
◦ Standard Usage: Defines color ranges (e.g., Green for high health, Red for low health). And base color if it’s out of ranges.
◦ Float as Bool (Single Pivot): If you set the same values in all thresholds (e.g., 10 everywhere), Color 1 will be applied below 10 and Color 2 above.
◦ Threshold Average: If you define two identical values in Threshold 1 (e.g., 5-5) and two identical in Threshold 2 (e.g., 10-10), the system calculates the average (7.5) to use as a binary pivot.
6.3 - Expanded vs. Compact View
The system allows you to adapt the space occupied by monitoring on your HUD via the Expanded boolean in the Data Table:
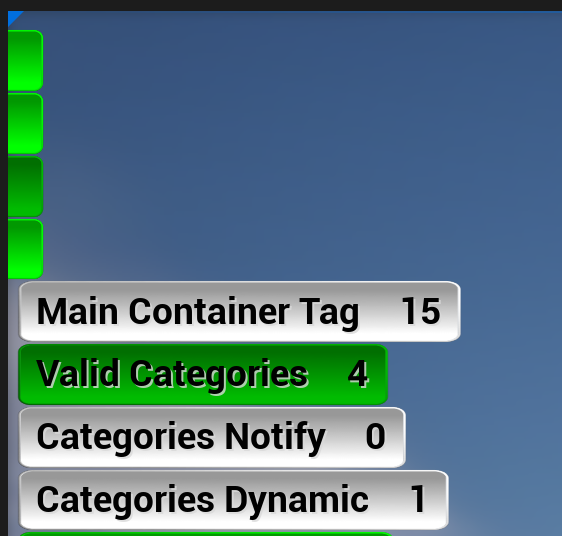
• Compact / Expanded Mode: In compact mode, the interface only displays a small color badge. This is ideal for having an overview of many systems without cluttering the screen. You know everything is fine as long as the dots are green.
• Usage: You can simply enable or disable it by clicking on the Dynamic in the panel or via the dynamic settings in the DT..
6.4 - Workflow: Creating and Updating a Value
Unlike notifications, dynamic monitoring is "pulled" by the system via the object's interface:
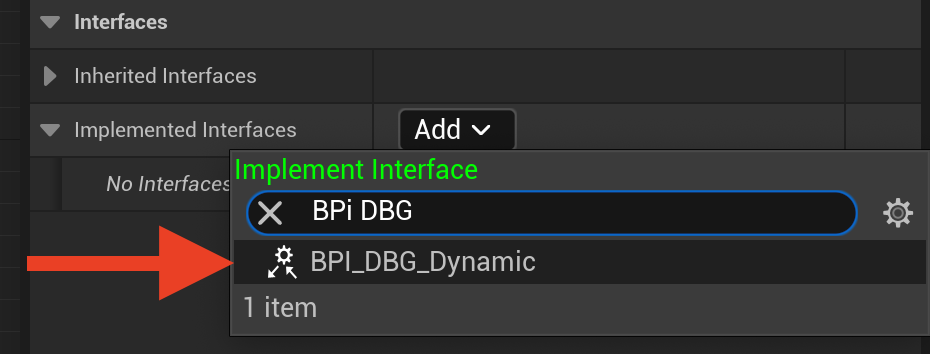
1 - Interface Implementation: You must first implement the BPI_DBG_Dynamic interface in the object (Actor, Component, etc.) from which you want to visualize variables.
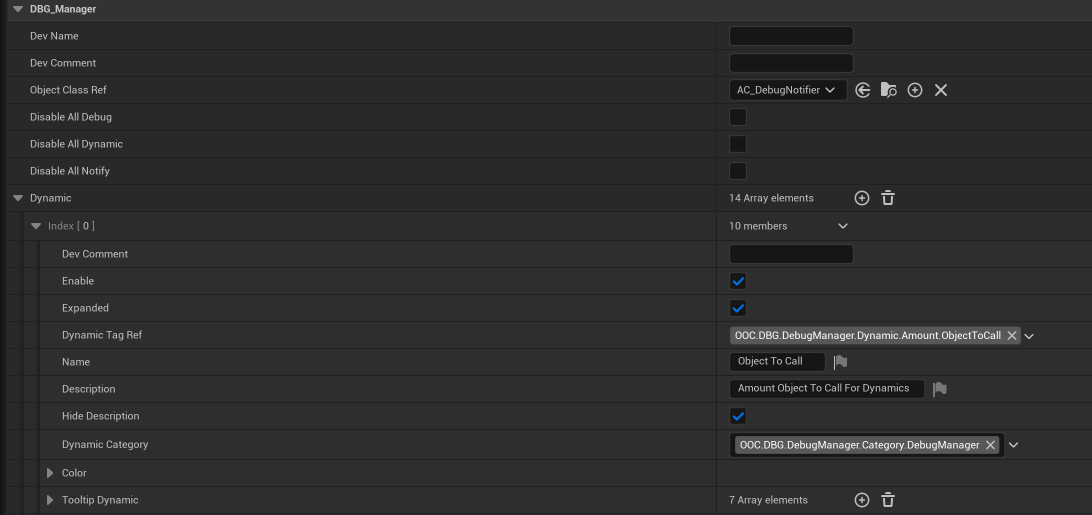
2 - Data Table Configuration: Create the dynamic elements in the Data Table row corresponding to this object. Assign Tags, display names, and visual options (Expanded, Colors).
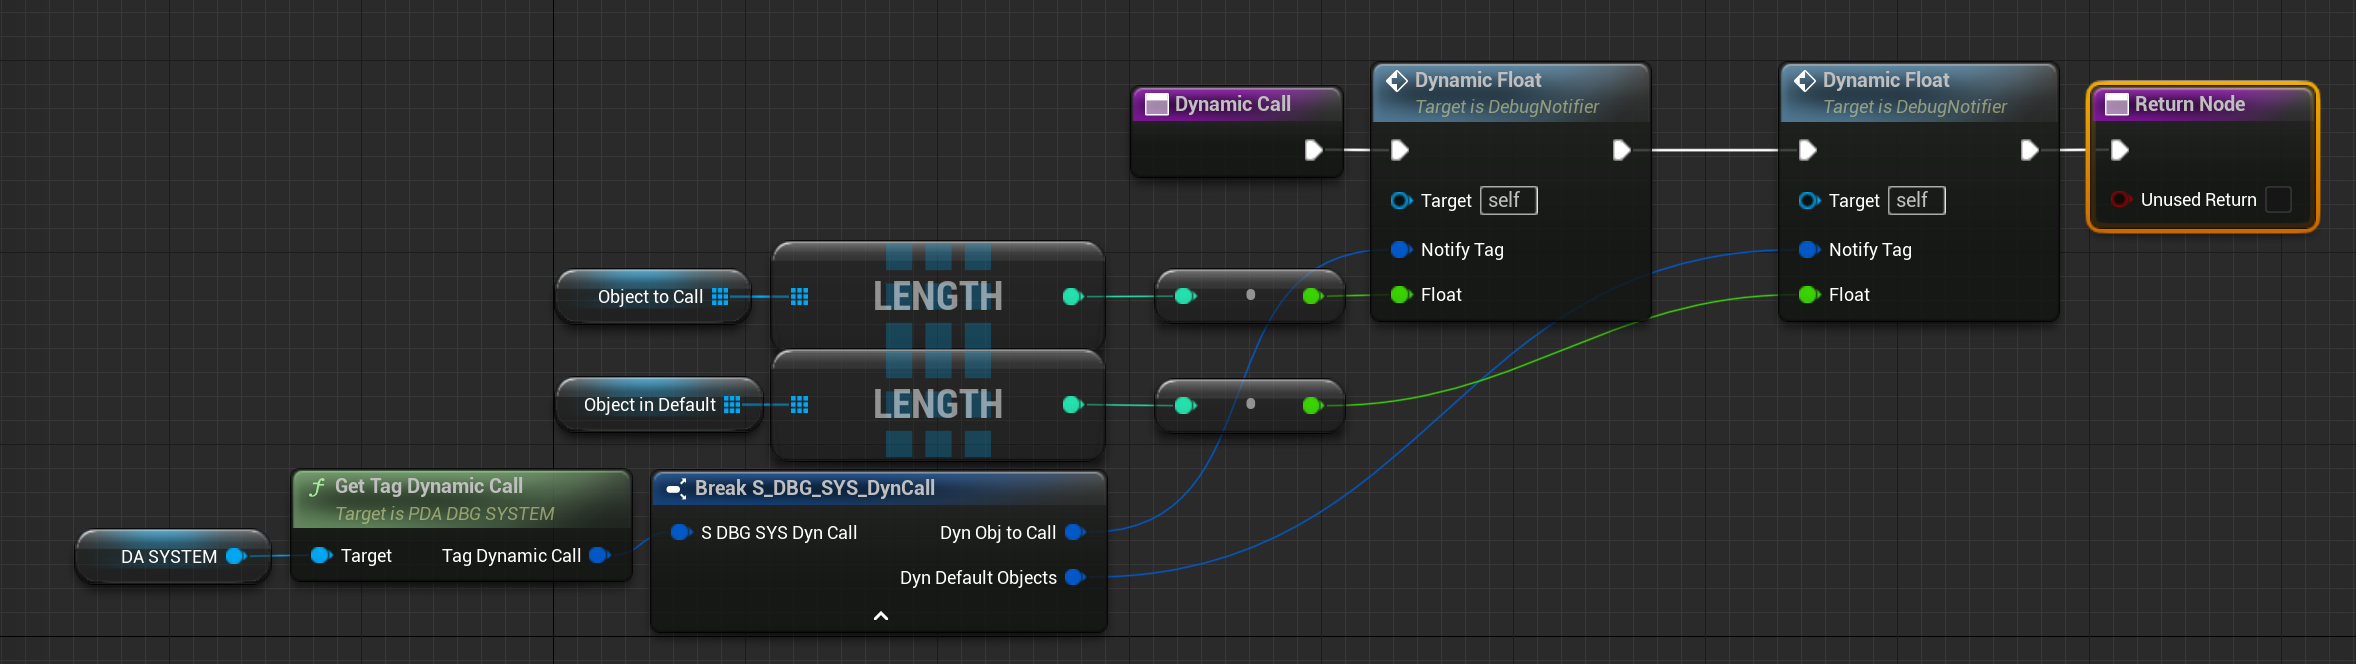
3 - Interface Logic (DynamicCall): In your Blueprint, implement the DynamicCall event from the interface. Inside this function, place all desired debug nodes:
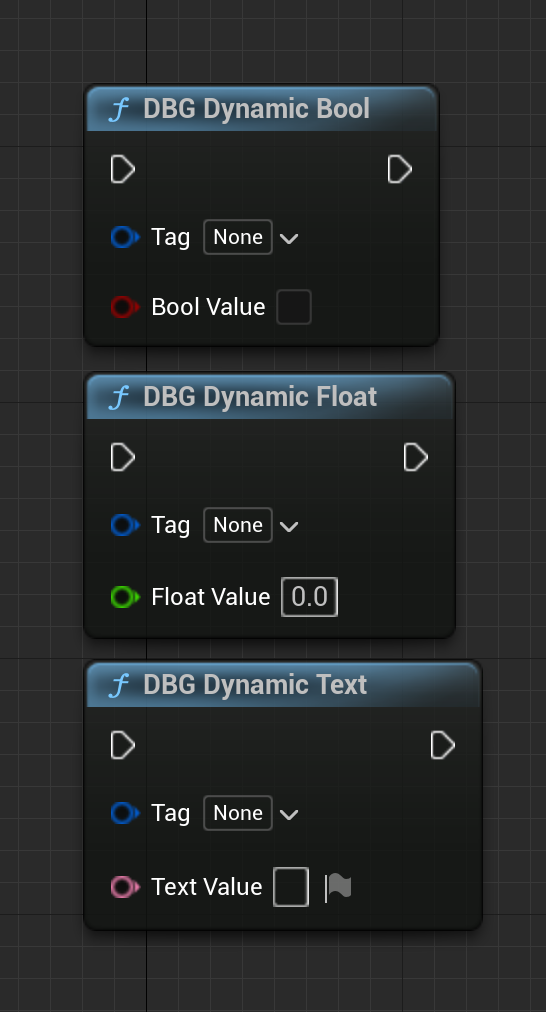
◦ DBG Dynamic Bool
◦ DBG Dynamic Float
◦ DBG Dynamic Text
For each, connect the Tag defined in the DT and the Variable to be monitored.
4 - System Management: Once this wiring is complete, the system automatically calls these functions based on the selected categories and display needs.
Delta-Update Optimization: Even during these calls, the system compares the current value with the cache. If the value hasn't changed, the graphical interface is not updated.
Note: I personally recommend using Data Assets to centralize your Gameplay Tags for a cleaner workflow.
Beyond Basic Types: The system is not limited to Bools, Floats, or Texts. While these cover most use cases and allow for dynamic colors, you can monitor any type (e.g., Vector, Rotator) by converting it to Text.
7. INTERFACE & UX (DEBUG PANEL)
The Debug Panel is the system's advanced control interface. It has been designed to be both comprehensive and non-intrusive, allowing for a full diagnostic without interrupting the development flow.
7.1 - Panel Structure
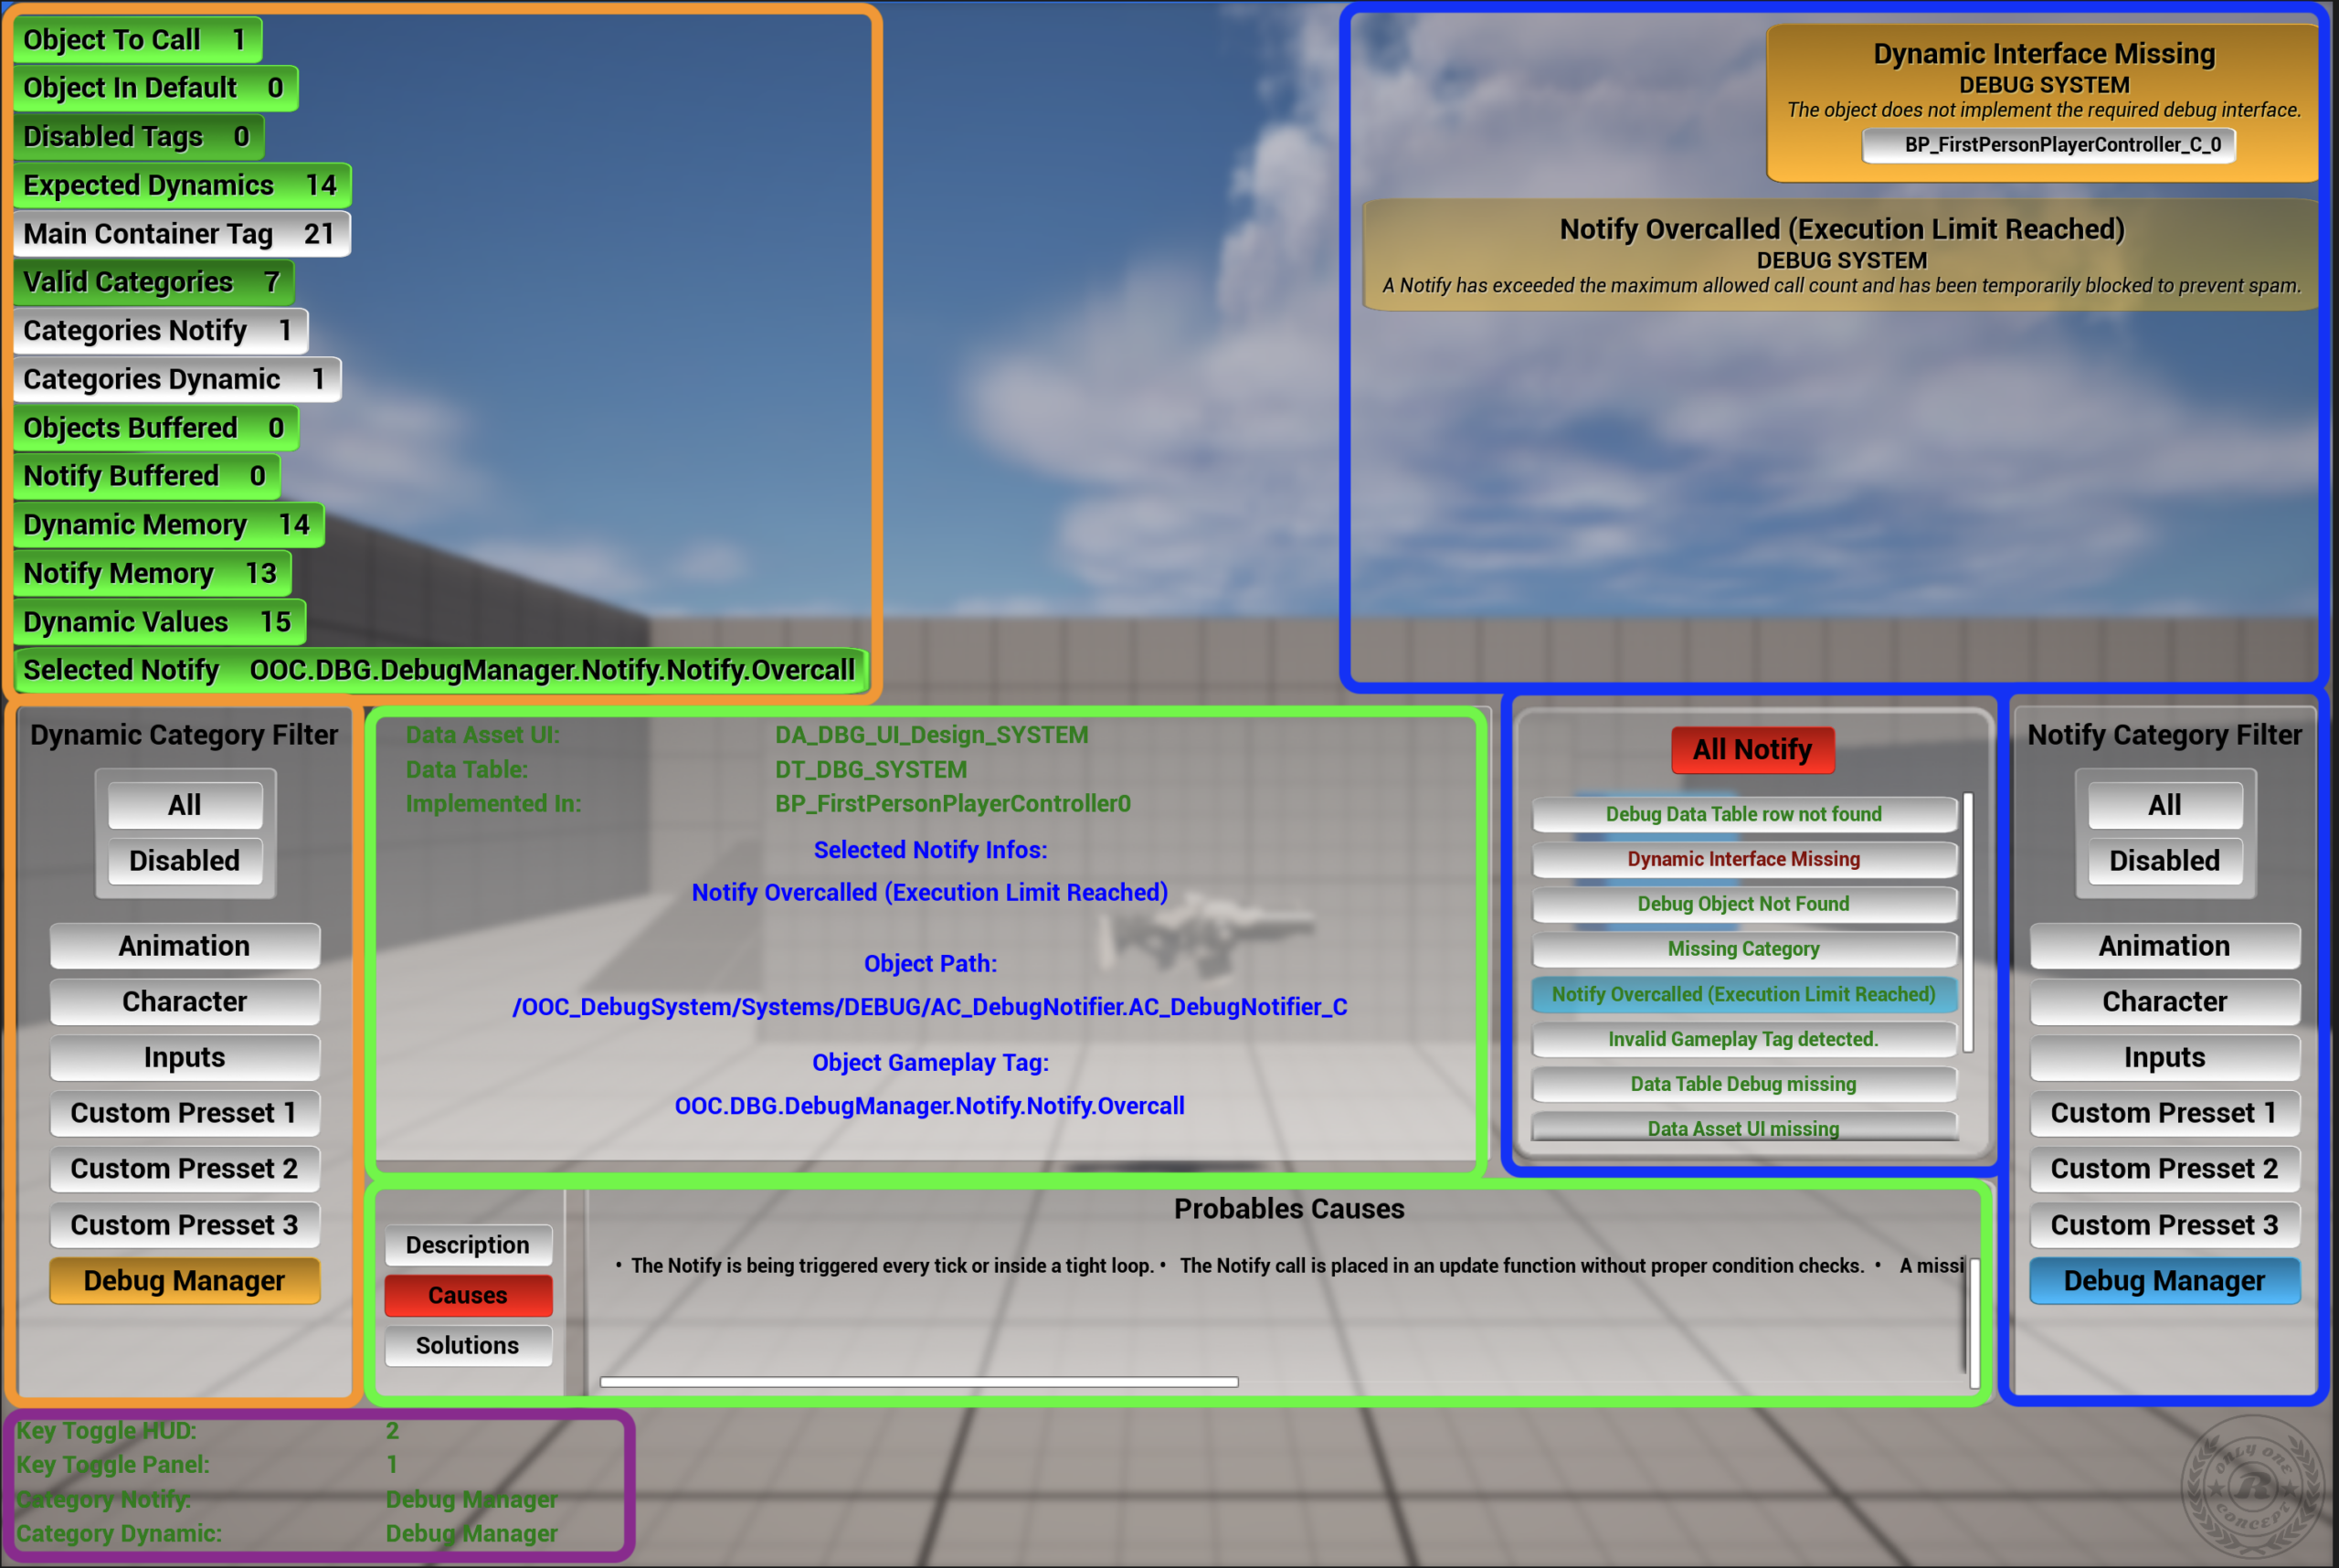
The panel interface is symmetrically organized to separate data flows:
Left Zone (Dynamics) : Displays all continuously monitored values. Elements can be unfolded (Expanded mode) or stay compact to save space.
Right Zone (Notifies) : Complete session event history. A color code indicates the notification status for the buttons:
🟢 Green : Inactive notification (never called or “Ghost”(Preview)).
🔴 Red : Active notification on screen.
🟠 Orange : Acquitted notification (the issue is noted, but the popup is hidden).
Central Zone (Inspecteur) : When a notification is selected, this area displays extended information (Description, Causes, Solutions) as well as the Path of the emitting object. This is where the "Project Memory" resides.
Run Lines: Quick information lines indicating the debug selection statuses.
7.2 - Status Indicators (Run Lines & Status Dot)
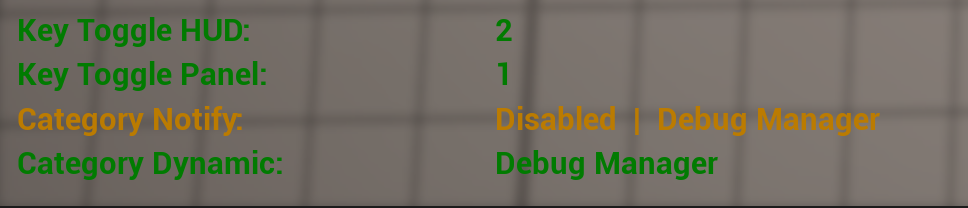
Even when the panel is closed, the system communicates its state via Run Lines (the green/red horizontal lines at the bottom of the screen):
Run Lines Color Logic: :
Red : Critical configuration issue. This can mean a missing configuration (empty category or none selected), a shortcut key not found in the IMC, or a missing Data Table (DT) or Data Asset (DA) in the component.
Orange : Categories are selected, but "Disabled" mode is active (HUD hidden).
Green : System is operational and ready.
Timer & Status Dot : The TimerHideRunLine parameter (located in the UI Data Asset) allows you to automatically hide these lines after a delay. They are then replaced by the Status Dot (a discreet point). This point acts as a "Heartbeat," visually confirming that the plugin is still running in the background even if the HUD is empty.
Positive Value (> 0): Run Lines appear at startup or during a state change, then automatically hide after X seconds to make room for the Status Dot.
Zero Value (= 0): Run Lines remain permanently displayed on screen. They are never replaced by the dot.
Negative Value (< 0): The system starts directly in discreet mode. Run Lines never appear at launch; only the Status Dot is visible from the beginning.
7.3 - Controls & Navigation
The system is controlled via two types of inputs:
Global Shortcuts (IMC):
Key Toggle Panel : Toggles the Debug Panel open/closed.
Key Toggle HUD Panel (Master Toggle) : Instantly hides or shows the entire HUD (useful for clearing the screen quickly).
UI Navigation :
Category Filters: You can select multiple categories simultaneously to filter both the left and right columns.
"All Notify” Button : This button allows you to toggle the display of inactive notifications based on the selected categories.
Default (False): Only notifications currently active on screen are displayed.
Enabled (True): Allows exploring all notifications registered in the Data Table for the active categories. This is the ideal tool for consulting help, notes (Causes/Solutions), file paths, and tags associated with past or potential events.
7.4 - Extended Infos
This area is the heart of the "Project Memory". It allows for the display of detailed information to help resolve complex issues without leaving the game.
Data Table Fields: In your DT, fill in the Description, Causes, and Solutions columns.
Button Logic: The interface is interactive. If a field is left empty in the Data Table, the corresponding button in the panel will be automatically grayed out and disabled. Buttons only become active if content is detected for the selected notification.
Formatting (Bulleted Lists): To create clear lists within the inspector and perform line breaks, use the -- (double hyphen) syntax.
Example: Check the volume--Check the tag
Result: The system detects the symbol, replaces the two hyphens, triggers a line break, and automatically adds a bullet point in front of each new element:
Check the volume
• Check the tag



7.5 - Visual Customization (Data Asset UI)
The display system and the visual feel of the plugin are entirely Data-Driven. This architecture was designed to be extremely flexible and adapt to the client's specific setup as well as their ergonomic preferences.
The file DA_DBG_UI acts as the aesthetic control center. Below are some of the parameters (not all are listed), but each field has a detailed Tooltip to guide you.
GLOBAL PARAMETERS & BEHAVIOR
UI Scale : Allows adjusting the overall interface size based on text size. This makes the entire HUD larger or smaller while maintaining the proportions of each element.
Animation Speed : Sets the velocity of the interface animations (transitions, openings).
UpdateDynLink (Bool) : Defines whether a notification displaying a dynamic link should update in real-time if the variable changes, or if it should remain frozen at the value it had when it appeared.
The update occurs if the dynamic in question is currently being visualized (called). Otherwise, it remains fixed from the moment the notification appeared.
Base Colors : Allows adjusting the fundamental system colors to harmonize them with your project.
GROUP CUSTOMIZATION (DYNAMICS, NOTIFIES, BUTTONS…)
For each interface section (Dynamics, Dynamic Linked, Notify, Lines Infos, Extended Infos Zone, Buttons), you can adjust:
Texts & Labels : Ideal for translating the interface into another language or changing default names.
Sizes & Colors: Fine-tuning of typography.
Background Images: Ability to change background images to radically alter the visual design of notifications or dynamics.
SPECIFIC NOTIFICATION PARAMETERS (NOTIFY)
The notification HUD features precision settings:
Font Size Badge : Defines the number size inside the counter badge.
Multiplicator Badge Size : Automatically calculates and adjusts the circular badge size based on the text size.
Opacity Hovered : Sets the opacity level when an element (Notification or Dynamic) is hovered.
Speed Animation Progress Bar : Adjusts the display time for Low category notifications. By default, the animation lasts 7 seconds; adding a value will increase or decrease this duration on screen.
Specific Images : In addition to the base images, you can define a Critical Image to give a unique and more alarming look to critical notifications.
USING PRESETS
The DA_UI can be duplicated to serve as Presets. This allows for different configurations based on screen types (4K, Laptop) or users, enabling the system to adapt to all hardware setups and your team's personal preferences.
8. APPENDICES
8.1 - FAQ & Troubleshooting
The system features its own diagnostic notifications to help you identify configuration errors (Red Run Lines, anti-spam alerts, etc.). Here are the major points to monitor:
DA Crash : Reminder: The Play/Stop procedure is mandatory before any modification to plugin Data Assets.
AC_DebugNotifier Auto-Destruction: Wrong Owner. This component is designed to run exclusively within a Player Controller. It will self-destruct if placed on any other Actor.
Notification Not Visible: Check the "All Notifies" history or verify your current category filters.
Missing Object:
1. Basic Check: Ensure you have correctly used the Add Object node if the object is not an Actor present at startup or if it is a component.
2. Engine Loading Order (Rare Case): In some cases, an object may initialize before the engine has created the Player Controller (which carries the brain component).
3. Reminder: The GameInstance, WorldSettings, GameMode, and GameState are generally loaded before the PlayerController.
4. Solution : If your object does not register on BeginPlay, add a short Delay (e.g., 0.1s or 0.2s) before calling the Add Object node to give the Controller time to stabilize.
GAMEPLAY TAG MAINTENANCE
Corrupted Tags: If you edit, rename, or delete a tag in your system, do not forget to update all its occurrences in your Data Tables and Blueprints. A renamed tag without a corresponding update will be considered invalid, and data will no longer be reported.
Moved Tables: If you move or rename a Gameplay Tag Table, verify that it is still correctly referenced in Project Settings > Gameplay Tags. If it disappears from this list, your categories and notifications will go silent..
SUPPORT & COMMUNITY
If you encounter a persistent problem, need a further technical explanation, or simply want to share your feedback, join us on Discord.
I will be happy to assist you personally:
Discord Link: : https://discord.gg/j6wDfrtA
Email Support: contact@only-one-concept.fr
Thank you for choosing Debug Notifier.
I sincerely hope this tool becomes a valuable ally in your workflow and helps you achieve great things on
Unreal Engine.
Happy Creating & Debugging!
⭐ Only One Concept ⭐